The bigger picture
Aside from the big individual stories this week, the debate on CEO pay, and inequality more generally, is likely to intensify as inflation squeezes the cost of living for workers — who have seen a 3-4% real pay cut on average, once adjusted for inflation.

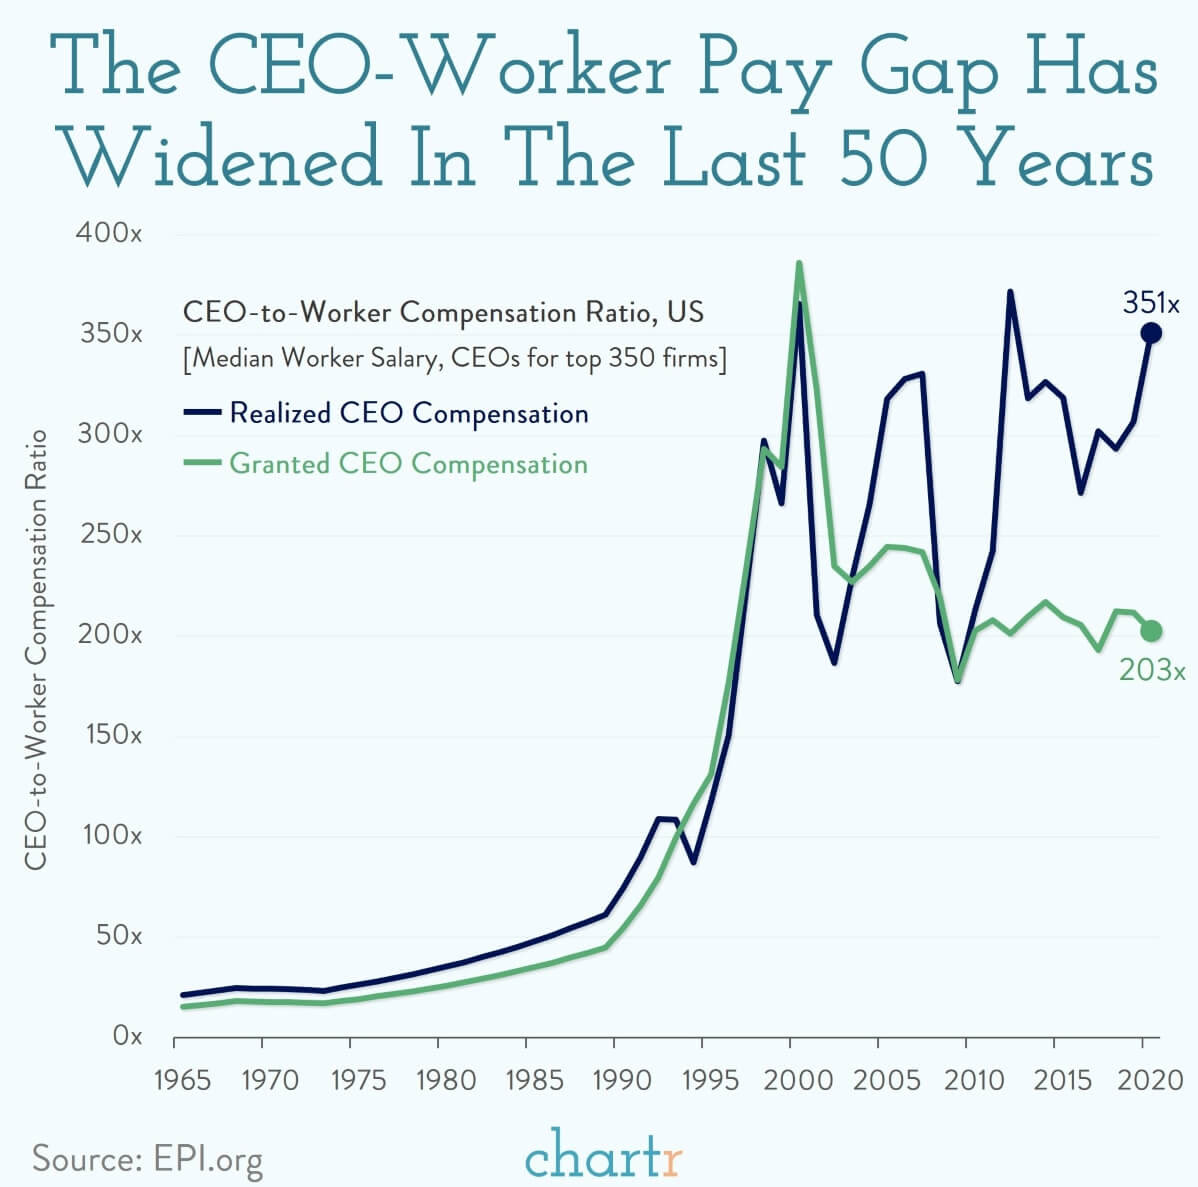
Indeed, this updated chart above, using data from the EPI shows how CEO compensation has outstripped that of typical workers over the last 50+ years.
From 1965-1970 the average CEO of a top company in the US earned 23x that of a typical worker. By 1990 that was 74x. In 2020 the average top CEO's actual, realized compensation was more than 350x that of a typical employee (the realized vs. granted difference is primarily down to stock market returns, as stock options and equity usually make up the majority of CEO compensation deals).