Every week it feels like we get a new headline about financial markets doing something unusual. Just this week we've had:
All of which begs the question: are we in a bubble?

Irrational exuberance
Answering that question is a bit like answering how long is a piece of string. Just limiting the question to US stock markets helps to narrow the focus, as does getting some help from Nobel laureate Robert Shiller.
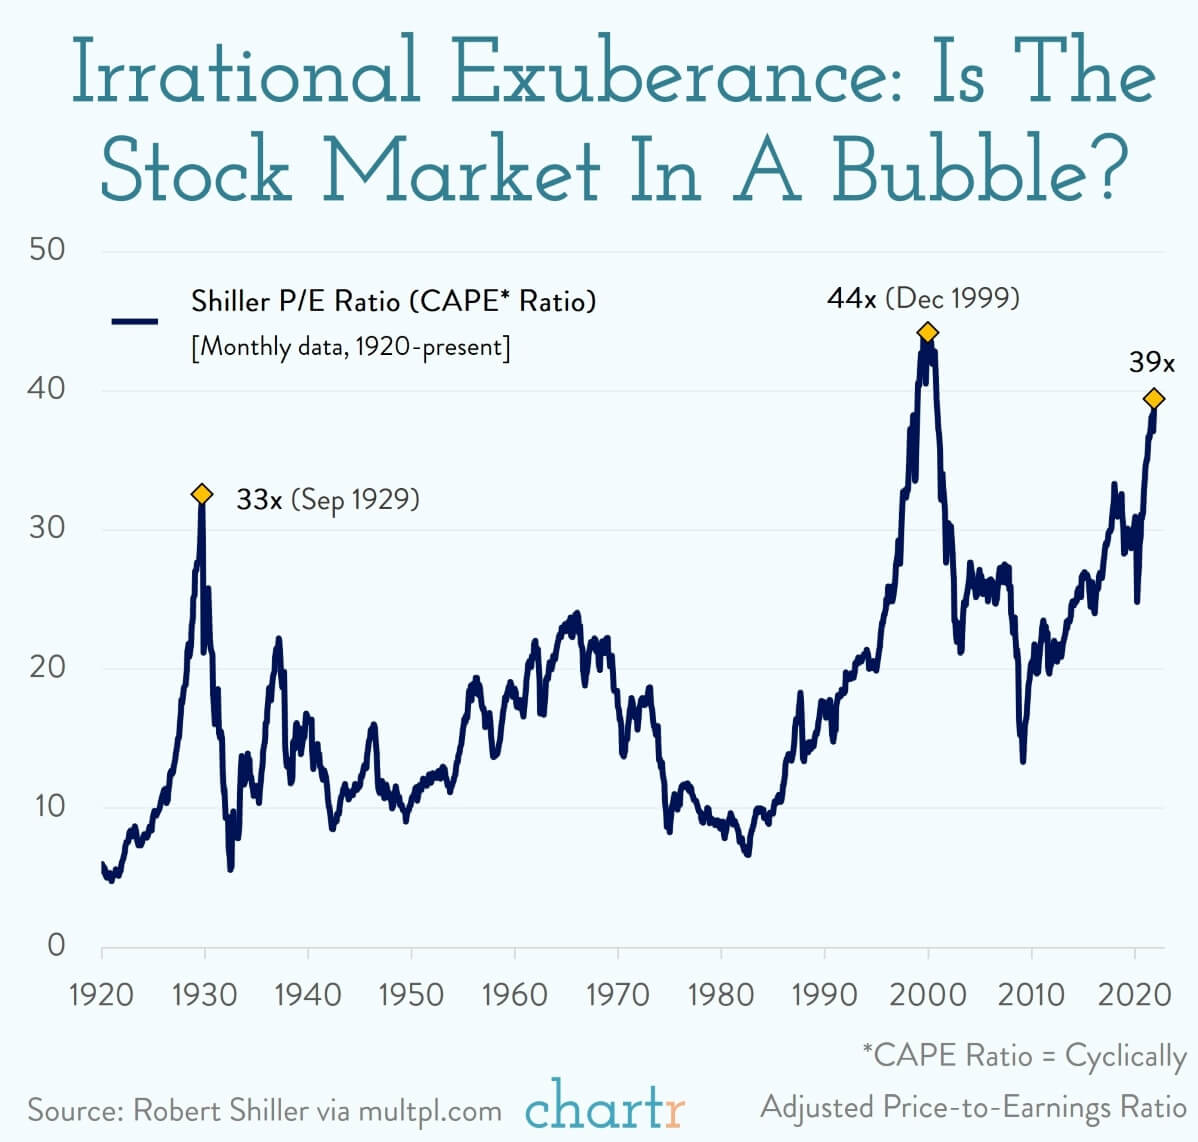
Shiller is the creator of the Cyclically-Adjusted Price-to-Earnings Ratio (CAPE).
A simple price-to-earnings ratio compares how much one share costs with how much it earns. A share that costs $100, and earns $5 a year, has a P/E of 20x. It's a rough but simple way to compare valuations between different companies, or history.
Shiller took that simple metric and... made it more complicated (but also probably better). Instead of just looking at one year of earnings, Shiller compares the price with the average from the last 10 years (adjusted for inflation). Doing that helps to smooth things out, as any company can have one good or bad year.
Lucky for us, Shiller has been calculating this CAPE ratio for the US stock market as a whole, for decades and decades.
So where are we now?
The latest CAPE ratio for the S&P 500 Index is 38x. That's pretty close to the all-time record, which was 44x back in 2000. For those with a short memory, that was just before the dotcom bubble burst and markets (particularly tech) crashed hard.